


Key Takeaways
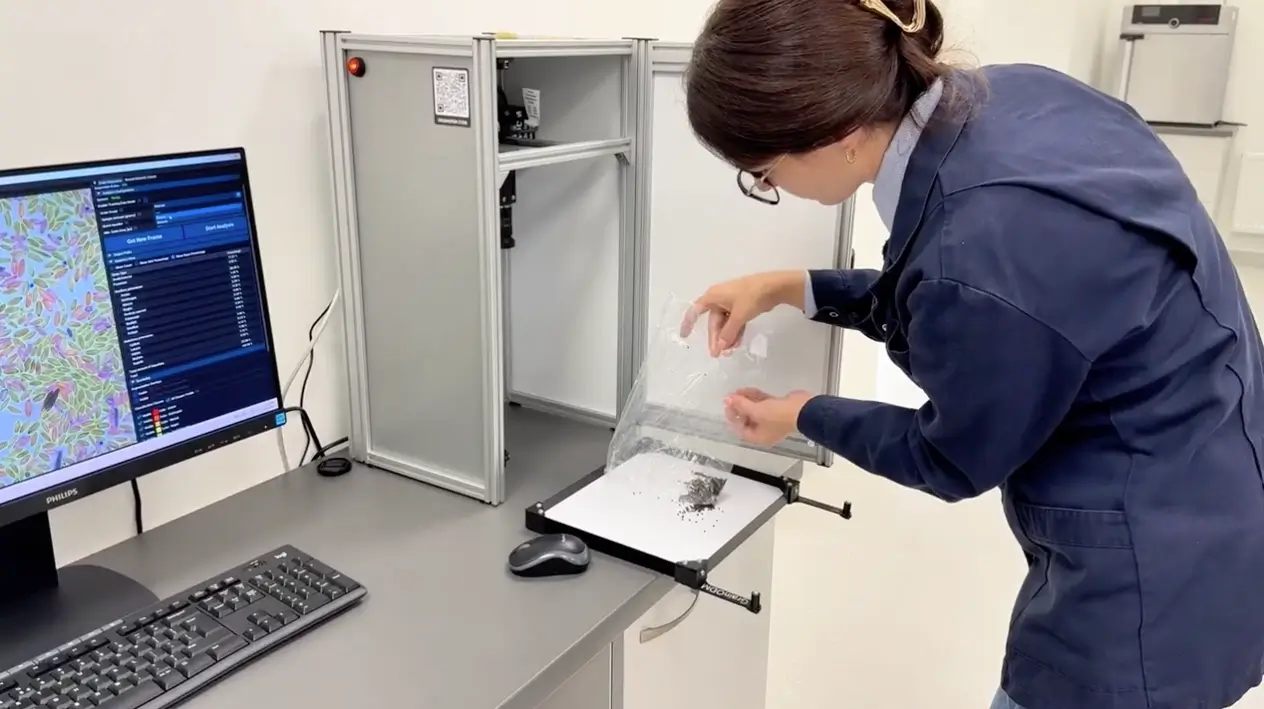
Sekargas Hamilton, an independent GAFTA and FOSFA accredited inspection company in the Baltic region, ran a structured head-to-head test: GrainODM against four of its own experienced technicians, on 10 wheat samples across 21 impurity categories.
GrainODM returned each analysis in about 3 seconds, against 8 minutes for a rushed manual test and roughly 30 minutes for a full EN 15587 analysis.
The AI was the most self-consistent participant in the test. Its impurity totals stayed within a 1.14pp band across all samples, tighter than any of the four technicians (1.43pp to 4.18pp).
In 7 of 21 impurity categories, the AI already measures inside the noise band of the human reference.
On aggregate accuracy, GrainODM landed inside the natural spread the lab's own technicians show against one another, while returning every result in about 3 seconds instead of 8 to 30 minutes.
Six categories, mostly visually similar damaged kernels, are still on the calibration list. Until targeted calibration closes them, GrainODM is positioned as a pre-screening and audit-trail layer that works alongside the lab, not an autonomous replacement for it.
Nikolaj Stankevič, Head of Inspections at Sekargas Hamilton, reviews the pilot on the record: data transparency, traceability, and faster access to results are where he sees the value for their clients.
Most AI case studies are written by the vendor. This one starts with a company whose entire business is being the neutral party.
Sekargas Hamilton, UAB is one of the leading independent inspection and quality control companies in the Baltic region. Based in Klaipėda and part of the international J.S. Hamilton Group, it provides sampling, laboratory testing, cargo inspection and certification for agricultural and other commodity sectors, accredited to GAFTA, FOSFA International and ISO/IEC 17025. When an exporter and a buyer disagree about a cargo, Sekargas Hamilton is often the party whose numbers settle it.
Our clients are exporters, importers, traders, processors and logistics companies, for whom a reliable and independent quality assessment is critical. We work every day in an environment where data accuracy, traceability and trust are essential.
- Nikolaj Stankevič, Head of Inspections, Sekargas Hamilton
That is a demanding place to test an AI system. So we did the test their way: same samples, same standard, their technicians, their laboratory. This post covers both halves of the story: the review from the inspection side, in Nikolaj’s own words, and the measured results of the head-to-head test, both where the AI already matches the lab and where calibration is still underway.
Why an inspection company started looking at automation
Nothing about the pressure Nikolaj describes is unique to the Baltics. It is the same pressure every quality function in the grain trade is under: more data expected, faster, with a shorter tolerance for error.
Cargo and quality control processes are becoming increasingly complex, and clients expect faster access to information and greater data transparency. A large share of these processes has historically relied on manual data collection and administration, so we saw an opportunity to increase efficiency, reduce the risk of errors and ensure even better data traceability throughout the inspection process.
- Nikolaj Stankevič, Head of Inspections, Sekargas Hamilton
The important word there is traceability, not speed. In an accredited inspection environment, a result that cannot be reconstructed later is worth very little. That framing shaped what we were asked to prove.
What they looked for in a partner
We were looking for a partner who understands not only technology but also the specifics of grain trading and quality control. It was important to us that the solution matched real inspection processes, ensured data integrity and traceability, and could be developed together with business needs.
- Nikolaj Stankevič, Head of Inspections, Sekargas Hamilton
This is the part vendors tend to underestimate. An inspection lab does not buy a camera. It buys a method it will have to defend to a client, an auditor, and occasionally an arbitration panel. Our job in the pilot was less about demonstrating a model and more about fitting inside a procedure that already works.
The test: 4 technicians, 10 samples, 21 categories
The pilot ended with a structured head-to-head comparison, designed by the laboratory rather than by us.
- 10 wheat samples, each analysed across 21 impurity categories
- 4 experienced Sekargas Hamilton technicians, plus GrainODM
- Roughly 840 individual measurements
- Method: EN 15587, in two modes
- Full analysis, ~30 minutes per sample
- Rushed analysis, ~8 minutes per sample, simulating peak-season conditions
- GrainODM: ~3 seconds per sample
- Each technician performed an equal number of tests in both modes, so mode effects could be separated from individual skill
- One sample was given twice to the same technician, as a repeatability check
- The reference value for every measurement was the average of the four technicians
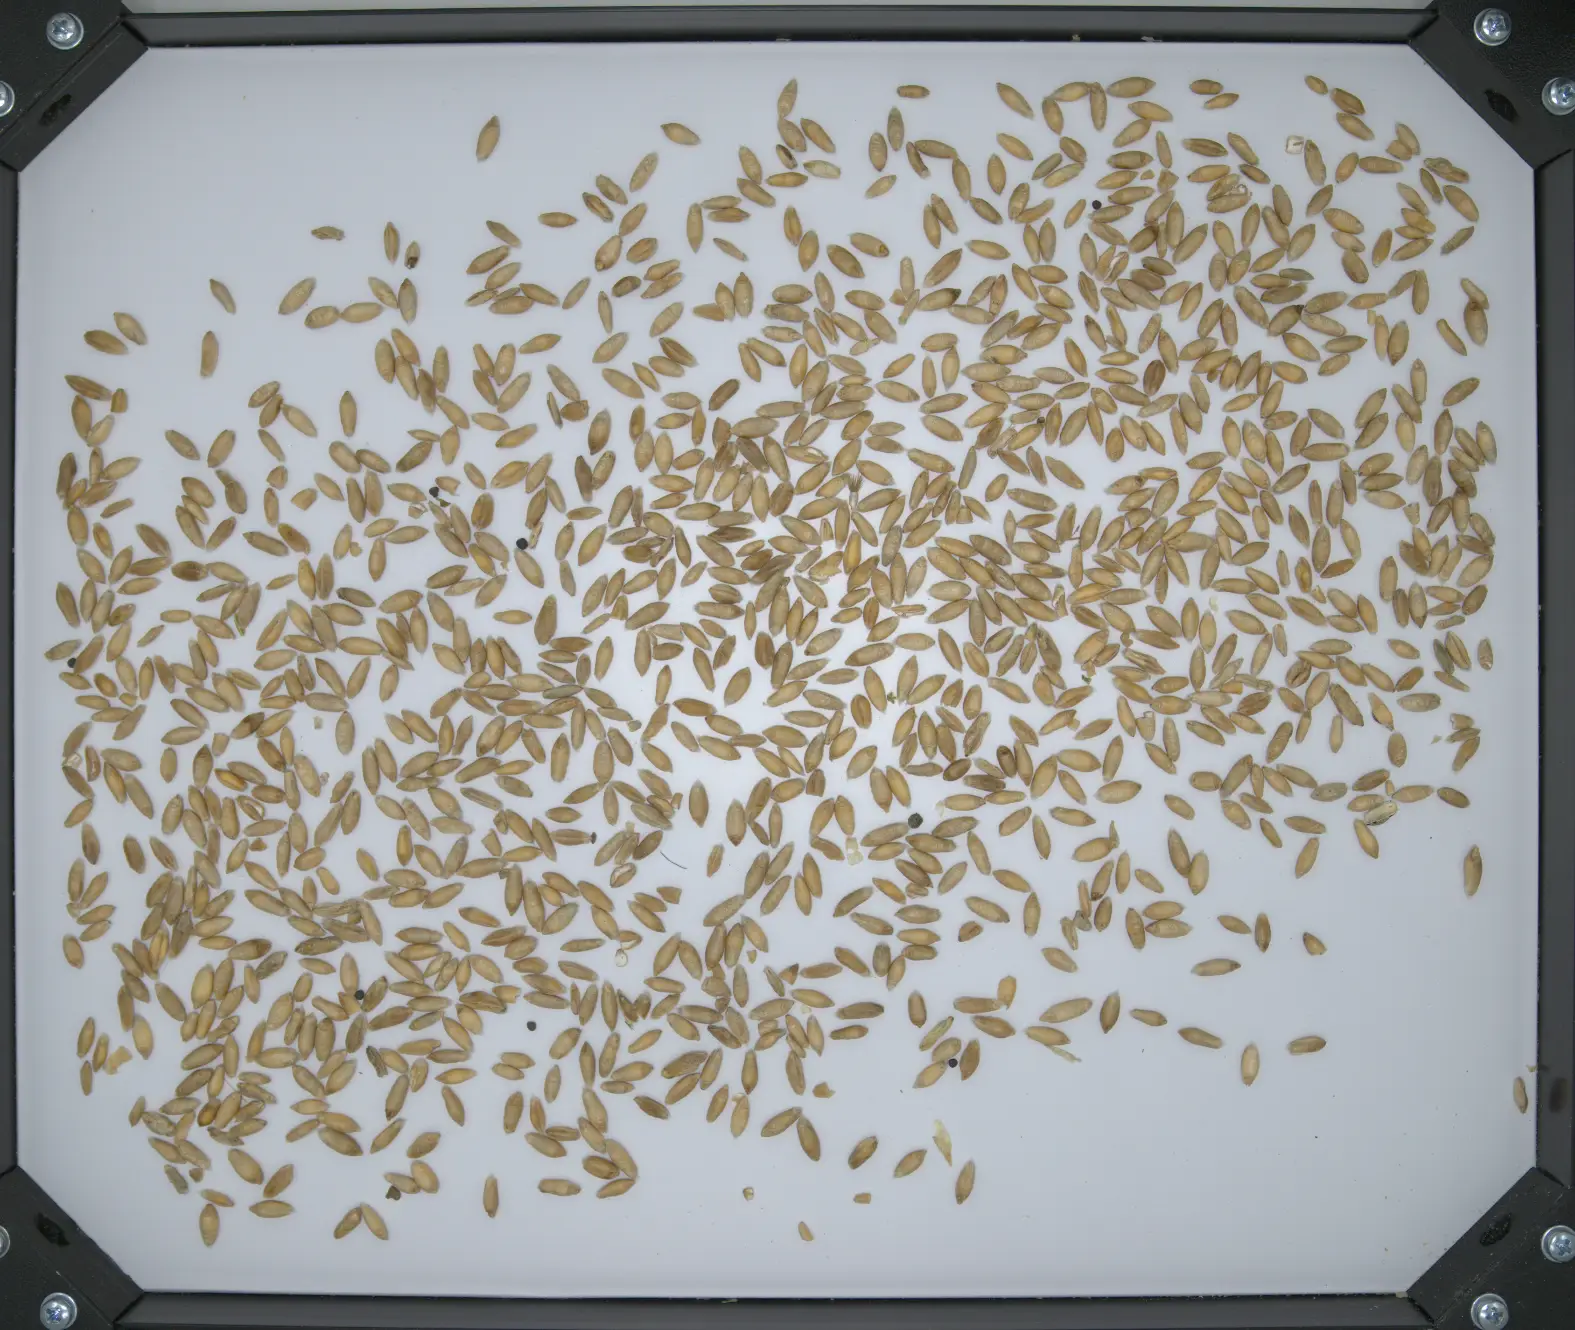
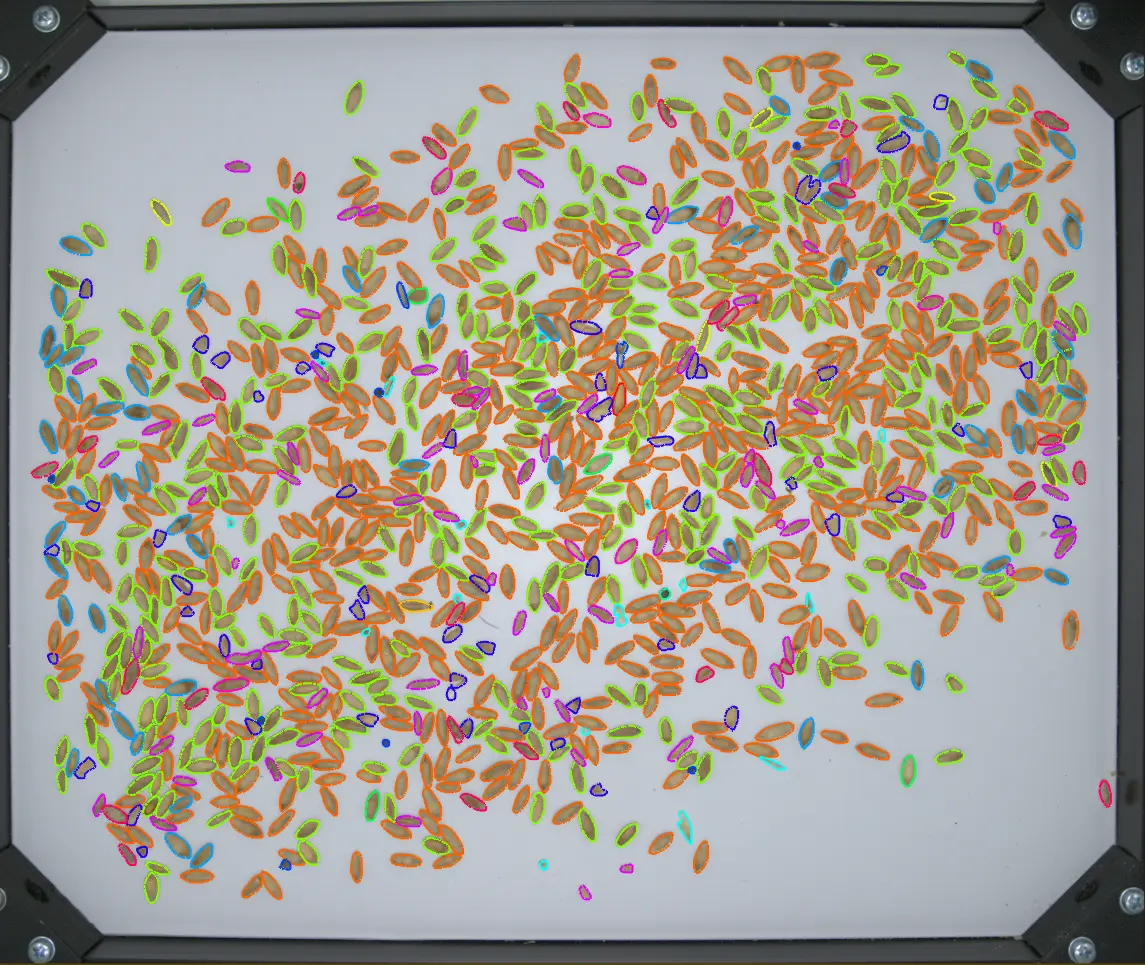
A wheat sample from the Sekargas Hamilton test: the raw plate versus every kernel segmented and classified by GrainODM.
There is no independent ground truth in impurity analysis. There is only the human reference, so the test was built to compare the AI against the collective judgement of four experienced technicians, on their own samples and their own standard.
Result 1: the AI was the most consistent participant, by a clear margin
When every fraction in a sample is added up, the total should land at roughly 100%. A total that drifts below 100% means some material went uncounted; a total above it means something was double-counted. How tightly a participant holds that line across ten different samples is a direct measure of internal stability, and the closer the whole range sits to 100%, the cleaner the accounting.
| Participant | Range of sample totals | Spread from tightest to widest |
|---|---|---|
| GrainODM | 98.87% – 100.01% | 1.14pp |
| Technician 1 | 98.57% – 100.00% | 1.43pp |
| Technician 4 | 98.20% – 100.36% | 2.16pp |
| Technician 2 | 97.66% – 100.48% | 2.82pp |
| Technician 3 | 95.60% – 99.78% | 4.18pp |
GrainODM held the tightest range of any participant, and it sat closest to the ideal 100%: every one of its ten totals fell between 98.87% and 100.01%, without the swings the manual counts show at the edges. That matters operationally more than it sounds. It means the same consignment measured twice, on two different days, by two different shifts, produces the same number. There is no “difficult morning” factor in a model.
Consistency and accuracy are two different things, so the next result looks at how close those stable numbers land to the lab’s own reference.
Result 2: on accuracy, the AI landed inside the lab’s own range
Accuracy here means the average distance from the four-technician reference. Measured that way, each individual technician was tighter to their own mean than GrainODM: the AI’s average deviation across roughly 840 measurements was about 0.49pp.
The number that puts it in context sits right next to it. The average spread between the four technicians on a single measurement was 0.66pp - in other words, on the same sample the lab’s own experts routinely differ from one another by more than the AI differs from their mean. GrainODM’s answer lands inside the range the technicians themselves occupy. For an image-based system on its first structured test in an accredited lab, sitting inside the human band on aggregate is exactly the result you want before calibration even starts.
And the aggregate figure hides the finding that actually matters: the per-category picture, where the gap between what already works and what is still calibrating is very large. That is the next two results.
Result 3: 7 of 21 categories are already at laboratory level
In a third of the impurity categories, GrainODM’s measurements are practically indistinguishable from the technicians’:
| Impurity | Technician average | GrainODM | Difference |
|---|---|---|---|
| Ergot | 0.001% | 0.008% | 0.01pp |
| Stones | 0.007% | 0.029% | 0.02pp |
| Husks | 0.061% | 0.025% | 0.04pp |
| Maize | 0.415% | 0.419% | 0.05pp |
| Oats | 0.227% | 0.251% | 0.05pp |
| Other impurities | 0.124% | 0.114% | 0.08pp |
| Barley | 0.989% | 0.941% | 0.08pp |
These are not the easy categories. Ergot, a toxic contaminant, and stones, the foreign body that damages mill equipment, are exactly what an inspection company cannot afford to miss, and the AI measures both inside the human noise band today.
Result 4: the six categories on the calibration list
Six categories still carry a gap large enough to matter commercially, and they are the focus of the calibration phase:
| Impurity | Technician average | GrainODM | Bias |
|---|---|---|---|
| Sound grains | 88.93% | 86.22% | -2.70pp |
| Darkened grains | 0.354% | 2.620% | +2.27pp |
| Small / shrivelled kernels | 1.588% | 0.526% | -1.06pp |
| Damaged grains | 0.059% | 0.738% | +0.68pp |
| Fusarium | 0.452% | 0.983% | +0.53pp |
| Triticale | 0.624% | 1.140% | +0.52pp |
The pattern is not random, and that is the encouraging part. Darkened, damaged and fusarium-affected kernels are one visual family - overlapping colour and texture cues that the classifier is currently separating too aggressively. Sound grains then absorb the residual as a mirror image of those errors. A gap that follows a clear visual logic is exactly the kind a calibration pass is built to close, which is why it stays with the technician in the meantime.
The fix is not a general model improvement. It is facility-specific training data: 50 to 100 real samples from the Sekargas Hamilton grain flow, weighted toward those categories, then targeted fine-tuning and a re-test on the same protocol with a statistically adequate sample count. That work runs 4 to 8 weeks, and it is a standard closing step for an image system entering a new facility, not a surprise.
Result 5: why a stable, documented measurement is valuable
The setup section made the point that there is no independent ground truth in impurity analysis, only the human reference. That is not a weakness of any one laboratory. It is simply what visual impurity analysis is: skilled human judgement applied to a physically heterogeneous material, which is why even expert results carry a natural spread from one measurement to the next.
That is exactly where an automated layer earns its place. A measurement that is stable, timestamped, image-backed and repeatable adds something the manual process never produced: the same consignment returns the same number, with a record you can reopen months later. Add speed and consistency on top, and the value shows up well before the last calibration gap is closed.
What would a 3-second pre-screen be worth at your throughput?
A full EN 15587 analysis runs about 30 minutes, a rushed one about 8. Estimate what an automated first pass could recover in lab hours at your own intake volume.
Try the ROI calculator →Where this leaves the deployment
Given the results above, the honest positioning is narrow and specific.
What GrainODM is used for today:
- Pre-screening at intake. A 3-second measurement on every load, triaging consignments into clear, borderline, and check-manually. Technician time goes to the samples that need judgement.
- Continuous monitoring. Every consignment gets a measurement and a photograph, rather than only the ones selected for full analysis.
- Audit trail. A timestamped, reopenable record with every object segmented and classified. This is documentation that manual grading simply did not produce.
What it is not used for:
- An autonomous replacement for laboratory analysis, particularly in the categories still calibrating. Those stay with the technician until calibration closes them and a re-test confirms it.
The review from the inspection side
Nikolaj’s assessment of the pilot process itself, on the record:
The pilot stage was constructive and results-oriented. The GrainODM team worked actively with our specialists, responded quickly to observations and sought to understand our real working processes. We value the fact that the solution was improved on the basis of practical user experience, and that communication throughout the project was open and effective.
- Nikolaj Stankevič, Head of Inspections, Sekargas Hamilton
On where the value lands for their own clients:
We see the greatest benefit for clients in data transparency, faster access to information and better traceability. Digitalised processes make it possible to share results more quickly, ensure consistent data management and provide more confidence in the decisions being made. In grain trading, where quality data often becomes an important part of commercial decisions, this is a significant advantage.
- Nikolaj Stankevič, Head of Inspections, Sekargas Hamilton
And his answer to the question we asked last, which is the one most quality managers are actually sitting with:
Process automation today is becoming not a competitive advantage but a natural direction of business evolution. The most important thing is to start from clearly identified processes and to choose a partner who understands the specifics of your operation. Our experience shows that properly implemented digitalisation increases efficiency, reduces the administrative burden, improves data quality and creates greater value for clients.
- Nikolaj Stankevič, Head of Inspections, Sekargas Hamilton
What we took away from it
A vendor-run demo would have shown the seven categories and stopped. A test run inside an accredited inspection laboratory showed all twenty-one, and the six still on the calibration list told us more about where to go next than the seven that already match.
Three things we would repeat at any facility considering this:
- Test against multiple technicians, not one. A single reference hides the variance that determines what “accurate” can even mean at your site.
- Report per category, not in aggregate. A single headline accuracy figure is close to meaningless when category sizes span four orders of magnitude.
- Deploy to the use case the data supports. Pre-screening and traceability are defensible on this evidence today. Autonomous grading in the categories still calibrating is not yet, and being straight about that is how a pilot turns into a long-term deployment instead of a dispute.
The calibration work at Sekargas Hamilton continues on real samples from their grain flow, with a defined re-test at the end of it.
Related reading: our validation against five lab technicians on 600+ wheat tests, the Allive hemp inspection case study, and a primer on EN 15587 besatz analysis for wheat.
Quotes from Nikolaj Stankevič were provided in writing in Lithuanian and are published here in translation. Test data: Sekargas Hamilton final testing round, April 2026, 10 wheat samples across 21 impurity categories, EN 15587.
Frequently Asked Questions
Sekargas Hamilton, UAB is one of the leading independent inspection and quality control companies in the Baltic region, based in Klaipėda, Lithuania, and part of the international J.S. Hamilton Group. It provides sampling, laboratory testing, cargo inspection and certification for agricultural and other commodity sectors, with GAFTA, FOSFA International and ISO/IEC 17025 accreditation.
Ten wheat samples were analysed across 21 impurity categories by four experienced Sekargas Hamilton technicians and by GrainODM, producing roughly 840 individual measurements. Testing followed EN 15587 in two modes: a full analysis of about 30 minutes and a rushed analysis of about 8 minutes that simulates peak-season conditions. Each technician performed an equal number of tests in both modes. The reference value for each measurement was the average of the four technicians.
On raw deviation from their own mean, the four technicians were individually tighter than GrainODM. But GrainODM’s average deviation, about 0.49pp, still sits inside the roughly 0.66pp spread the technicians show against one another, so its result falls within the range of the lab’s own experts. On top of that it was the most consistent participant of all and returned results in about 3 seconds instead of 8 to 30 minutes, and in 7 of the 21 categories its measurements already match the technicians outright.
The main gaps are in visually similar damaged kernels: darkened grains, damaged grains and fusarium-affected kernels, plus small or shrivelled kernels and triticale. These share colour and texture cues with sound grain, which is exactly where an image-based classifier needs facility-specific training data. The calibration plan runs 4 to 8 weeks on real samples from the Sekargas Hamilton grain flow.
As a pre-screening and documentation layer rather than a final verdict. Every load gets a measurement, an image and a timestamp in about 3 seconds, which triages consignments into clear, borderline and check-manually, and creates an audit trail that manual grading never produced. Categories with a known bias stay with the technician until calibration closes them.
 Live demo
See the AI in action
Run a real sample, no signup.
Try the live demoFollow GrainODM
Grain-tech insights, case studies and product updates.
Follow on LinkedInContinue reading
From Tweezers to Imaging: Grain Impurity Analysis at a GAFTA-Approved Port Laboratory
Case StudiesHow AI Cut Allive's Hemp Seed Inspection From 30 Minutes to Seconds
Case StudiesAI vs. 5 Lab Technicians: What We Found After 4 Months and 600+ Wheat Tests
Case StudiesManual Wheat Sprout Detection Fails: AI vs. Human Eye
See the AI grade a real grain sample
Run a sample in your browser and watch it flag every impurity. No signup, no sales call.