


Grain quality grading at intake carries real money. A fraction of a percent in the wrong fraction can move a load to a lower grade and trigger quality deductions. Yet one part of that grading, the assessment of impurities (Besatz), still comes down to a single technician’s eye, often under time pressure with trucks queuing at the weighbridge. When the seller cannot see how the result was reached, trust erodes fast.
This article does not settle who is right in any given dispute. It shows how the most subjective element of grading, visual impurity assessment, can stop being a matter of judgement, once it is replaced by objective, repeatable, grain-by-grain evidence.
What is actually being deducted for?
Two very different stages of quality assessment often get lumped together as “quality”:
- Physicochemical parameters: protein, moisture, gluten, falling number, test weight, or (for rapeseed) oil content. These are measured by an NIR analyzer or classical laboratory methods.
- Impurities (Besatz): broken kernels, shrivelled grains, sprouted, darkened, insect-damaged, foreign seeds and unusable matter. This is a visual assessment, done by hand at the point of receipt.
The distinction matters. GrainODM does not measure protein, moisture or falling number, those stay with NIR (see grain analyzers explained for how the technologies divide up). GrainODM handles visual impurity analysis only, which happens to be the part that generates the most friction, precisely because it is the most subjective.
The human factor at the sample tray
Correct impurity determination under EN 15587 means separating a representative sample into fractions: broken kernels, shrivelled grains, sprouted, insect-damaged, and Schwarzbesatz. At the peak of harvest, with a queue building, a technician has minutes to do it.
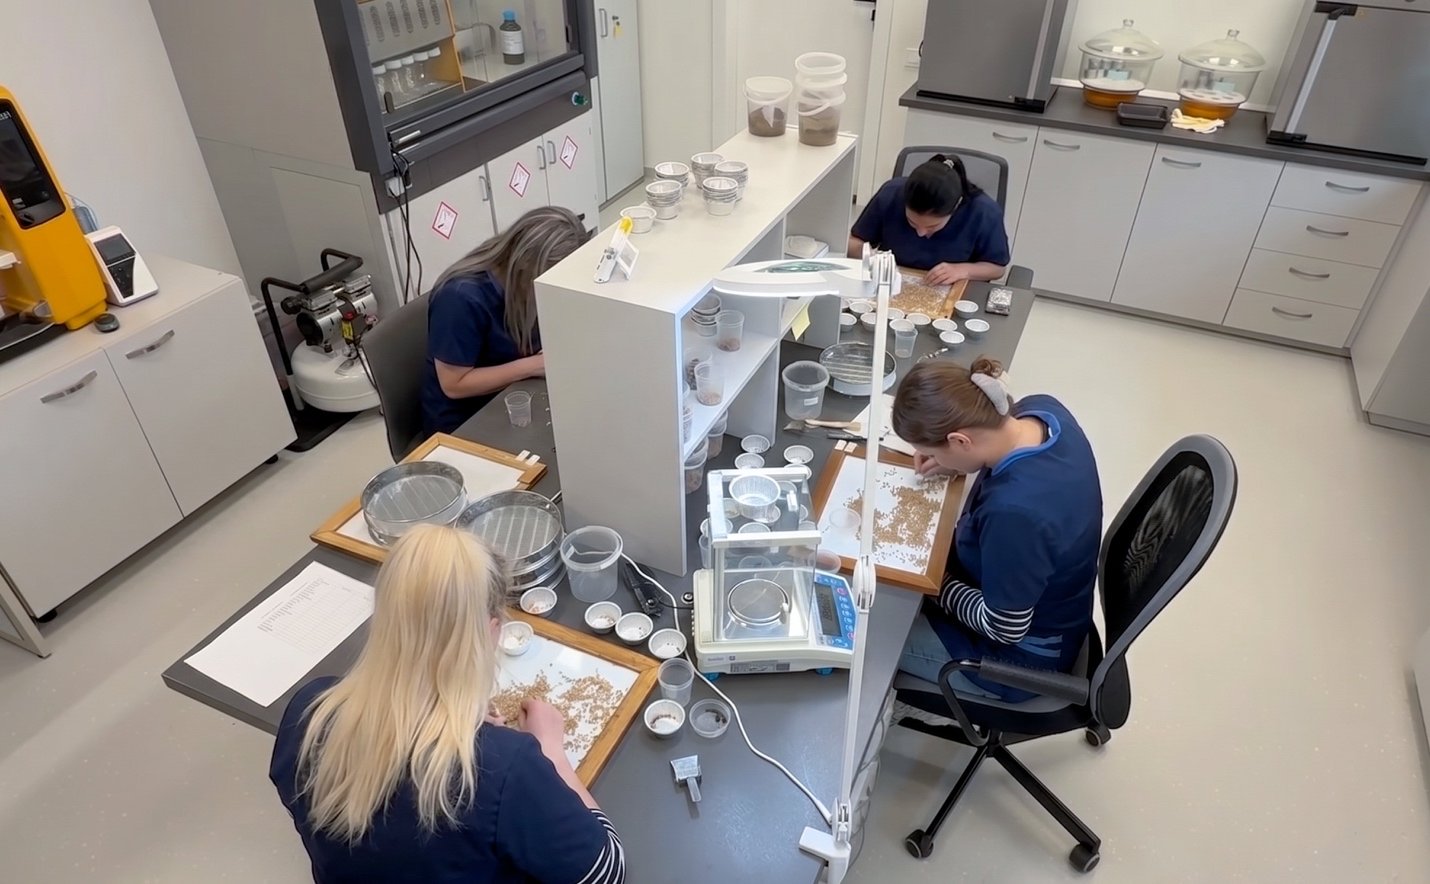
The problem is not bad faith. It is repeatability: two experienced analysts assessing the same sample can land on different numbers, and a fraction-of-a-percent difference can reclassify a lot and trigger deductions. For the seller that is a lower price per tonne; for the buyer it is the risk of a complaint and a dispute.
A clear boundary: what technology will not change
Let us be precise: automated visual analysis does not replace NIR. It will not settle an argument about protein level or test weight, those remain the domain of spectrometry and the lab.
What an optical system does change is the classification of physical impurities and grain damage, the place where a single tired operator’s eye decides today, and where a uniform, fully documented standard can decide instead.
An objective arbiter at the weighbridge
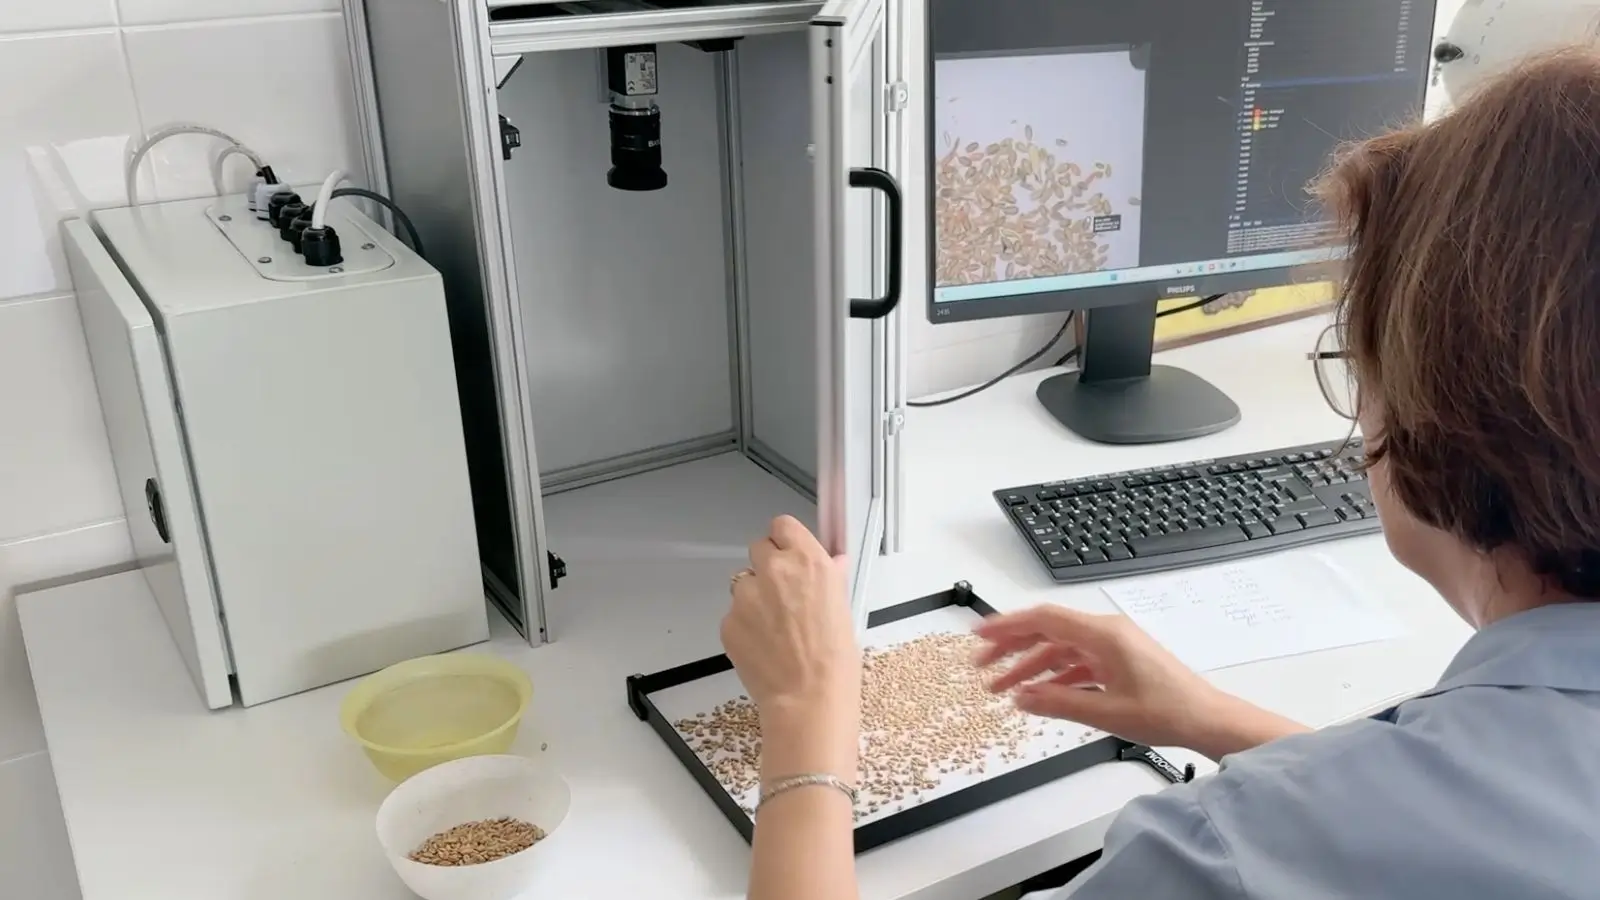
GrainODM takes a digital photograph of the spread sample and, in about three seconds, classifies every kernel individually: sound, broken, shrivelled, sprouted, darkened/heat-damaged, insect-damaged, and foreign seeds. It is tuned for wheat, barley, oats, rapeseed and hemp.
The output is not an opaque headline number but a high-resolution image of the sample with each fraction marked and classified, evidence both sides of the transaction can see. The repeatability and accuracy of the visual assessment is within the range of an experienced laboratory technician, with the difference that the same sample returns the same result regardless of the hour or fatigue. You can open a real digital impurity report and check the classification of every single grain yourself.
Evidence on paper and in a picture
Transparency is exactly what a shared, documented result delivers:
- A photograph of the sample with the classification overlay: the seller sees the same image the fractions were calculated from.
- Full repeatability: the same sample yields the same result, removing the random factor.
- An attachment to the delivery record: a clear evidentiary basis in the event of a complaint or an independent quality assessment.
For the elevator that means faster deliveries and fewer disputes at the window. For the seller it means the impurity assessment is no longer a matter of opinion. The same approach already holds up in international trade, as shown by this port inspection example in a GAFTA-accredited laboratory.
Conclusion
No single device will remove every tension between buyer and seller. But the most contentious part of visual grading, the split into impurity fractions, stops being an argument when one operator’s word is replaced by objective visual evidence. In the Besatz portion of the assessment, transparency is now a technical reality rather than an aspiration.
Want the methodology behind it? See the grain purity test and the EN 15587 (Besatz) guide.
Frequently Asked Questions
Manual impurity assessment under EN 15587 requires a technician to split a representative sample into fractions by eye, often under time pressure at intake. Two experienced technicians can reach different results on the same sample, and a fraction-of-a-percent difference can move a lot into a lower grade and trigger quality deductions.
No. GrainODM performs visual analysis of physical impurities and grain damage (Besatz) only. Physicochemical parameters (protein, moisture, falling number, test weight) remain the domain of NIR analyzers and the laboratory.
Broken kernels, shrivelled/thin grains, sprouted, darkened/heat-damaged, insect-damaged kernels and foreign seeds, following the EN 15587 fractions. It works on wheat, barley, oats, rapeseed and hemp.
The output is a photograph of the sample with every grain marked and classified, summarized in a digital report both sides can see. It gives buyer and seller a single, repeatable record instead of one operator’s judgement.
 Live demo
See the AI in action
Run a real sample, no signup.
Try the live demoFollow GrainODM
Grain-tech insights, case studies and product updates.
Follow on LinkedInContinue reading
EN 15587 Besatz in Wheat: Complete Technical & Operational Guide
GuidesFOSS Infratec 1241 Grain Analyzer: The Definitive Review for Modern Grain Analysis
GuidesGrain Analyzers Explained: Types, Features, and the Future of Grain Analysis
CompanyGrainODM at Linas Agro Open Doors 2026: AI Grain Analysis, Live in the Lab
See the AI grade a real grain sample
Run a sample in your browser and watch it flag every impurity. No signup, no sales call.