


Key Takeaways
The AI system reached 93.5% agreement with five independent grain lab technicians, landing inside the natural range of expert disagreement.
Early errors in darkened grains, rye-wheat hybrids, and small kernels dropped sharply once the model was retrained on the hardest edge cases.
The pilot used real intake samples over four months, not a lab demo, so results reflect everyday grading conditions.
AI did not replace lab staff; it changed where their time goes, taking over routine grading and surfacing edge cases for expert review.
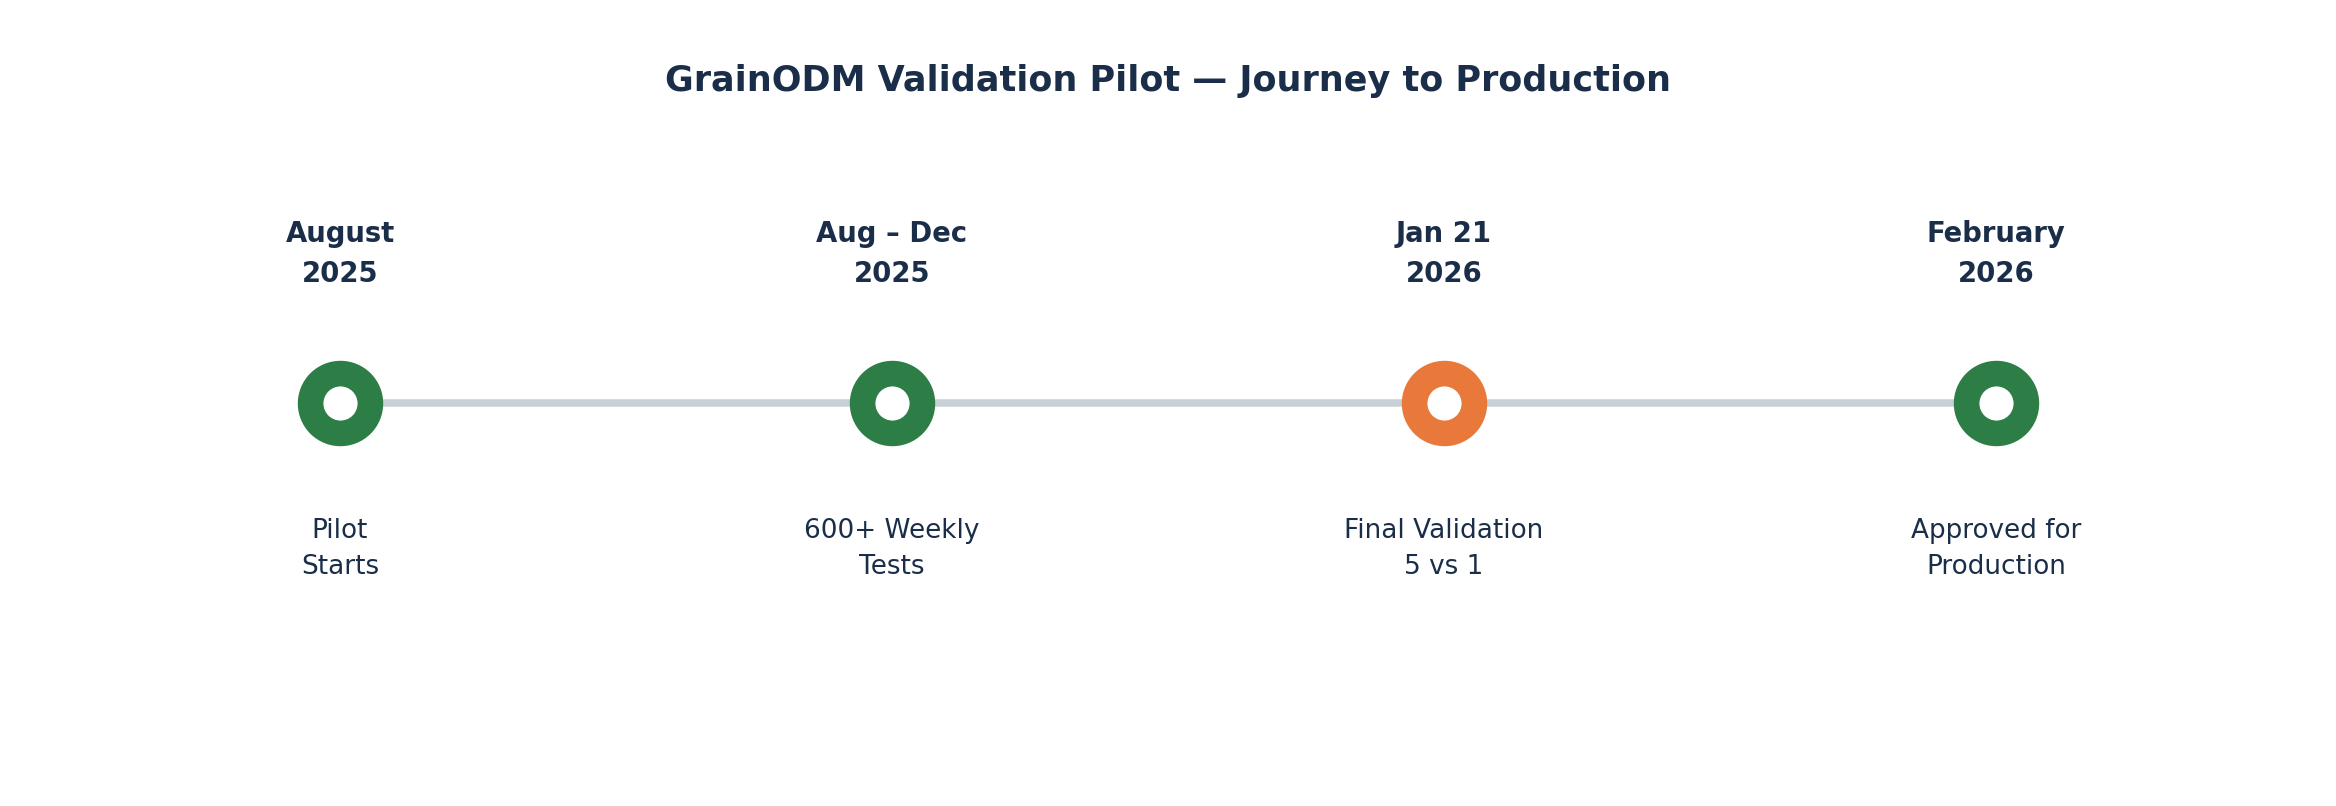
After 4 months and more than 600 tests, there was one final question: put 5 professional grain lab technicians and the AI in front of the exact same wheat samples. Do they agree?
That was the validation gate we agreed to at the start of the pilot. No softer benchmark. No averaging across ideal conditions. Five independent experts, one AI system, one session — and the result would decide whether GrainODM goes into production.
This case study details how we got there.
Why grain quality grading is harder than it looks
Wheat is not just wheat. When a batch arrives at a grain facility, a trained technician grades it across dozens of quality parameters: protein and moisture from instruments, and a long list of physical impurities that still rely on the human eye.
In this pilot, we tracked 18 distinct impurity categories, including:
- fusarium-damaged kernels
- barley, oats, rye, and rye-wheat hybrids
- broken and darkened grains
- pest-damaged, shrivelled, and sprouted grains
- debris, foreign seeds, Galium, hulls, and total grain/trash impurities
Even small shifts in any of these can move a batch from Grade 1 to Grade 4, with direct financial consequences. If you want to see how regulators treat these limits more broadly, we cover them in our grain admixture standards guide.
For a closer look at how individual defects like sprouted grains are detected in traditional labs, see our case study on wheat sprout detection.
Grading is also inherently subjective. Two experienced technicians looking at the same batch of darkened grains do not always land on the same percentage. That is not a failure of expertise. It is the nature of visual classification at the grain level, under real working conditions.
This is exactly why we chose not to benchmark against a single technician. Five independent experts gave us the natural range of human expert disagreement and a meaningful bar to measure the AI against.
Phase 1: The pilot starts - and the hard cases emerge
The pilot launched in August 2025 with a major agricultural holding. GrainODM ran in parallel with the client’s existing lab operations - the same real incoming grain batches, analyzed simultaneously. Every week, the team reviewed results together and fed findings back into the model.
By the end of the four months, this accumulated to more than 600 individual tests.
The first weeks were the most instructive. Three categories surfaced as the hardest cases:
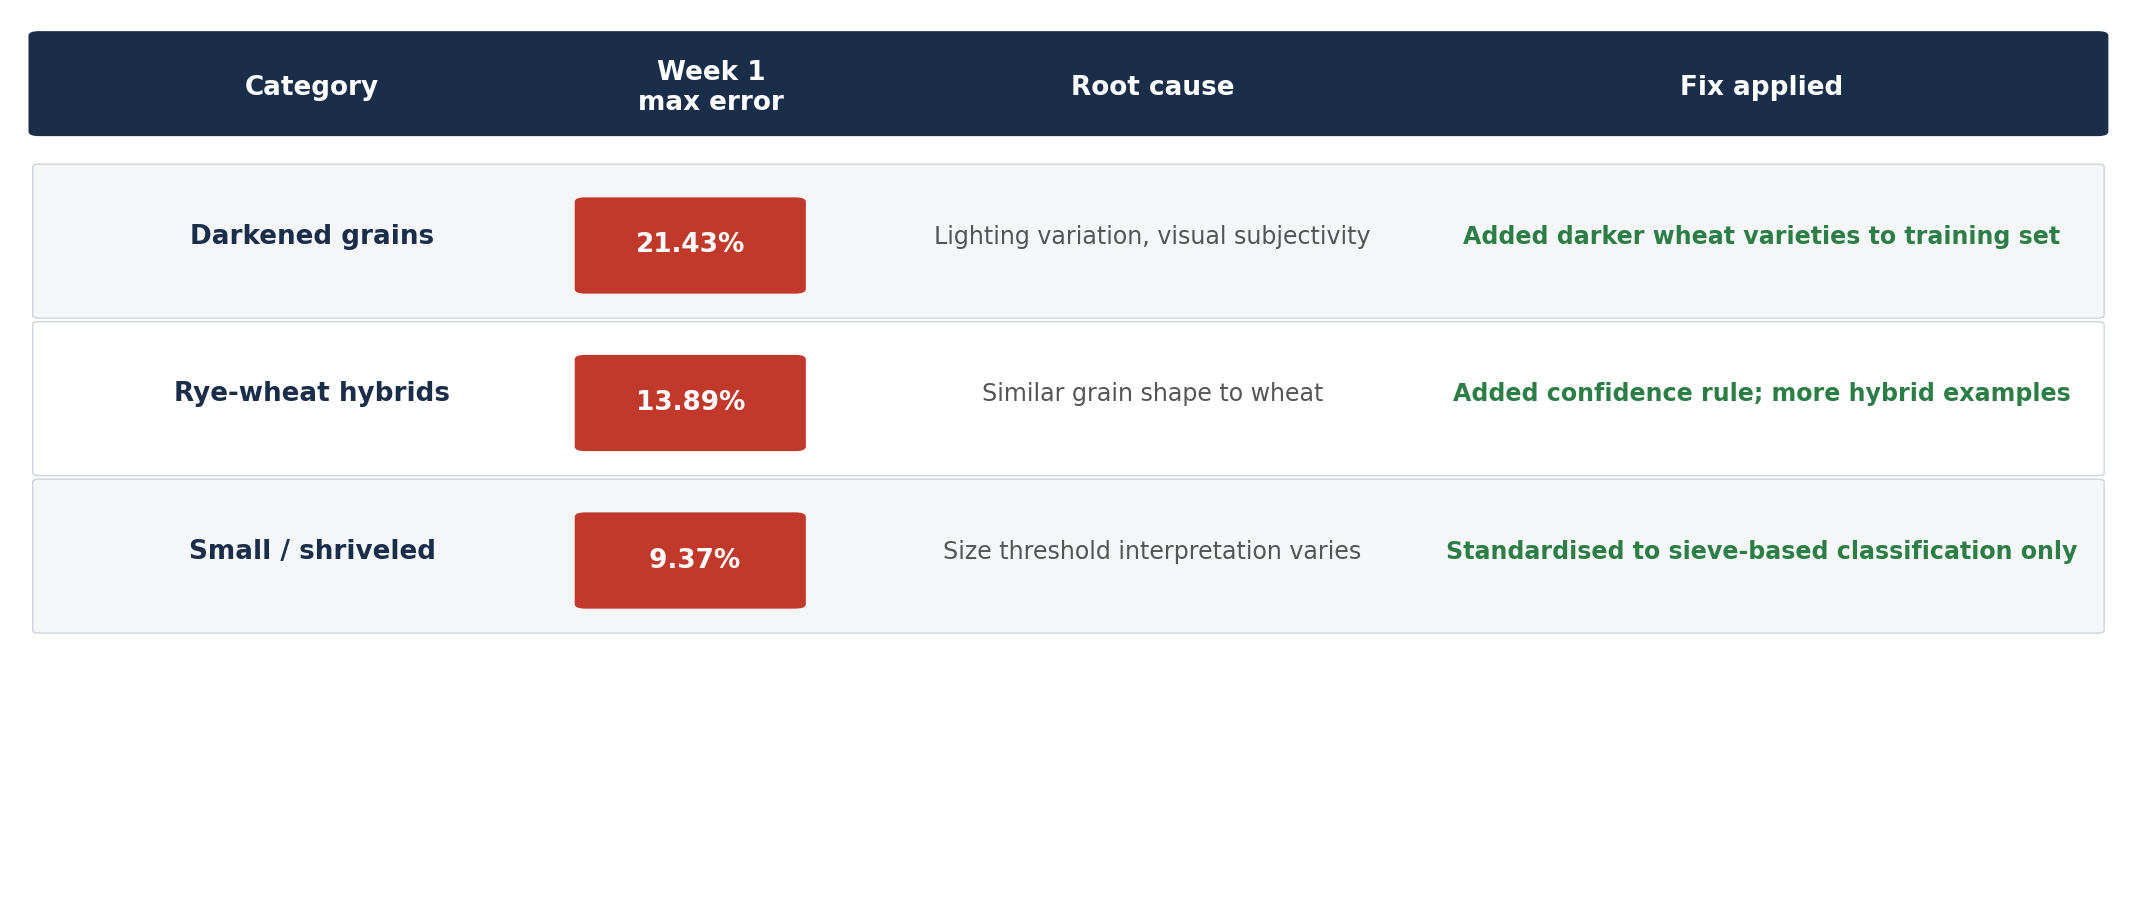
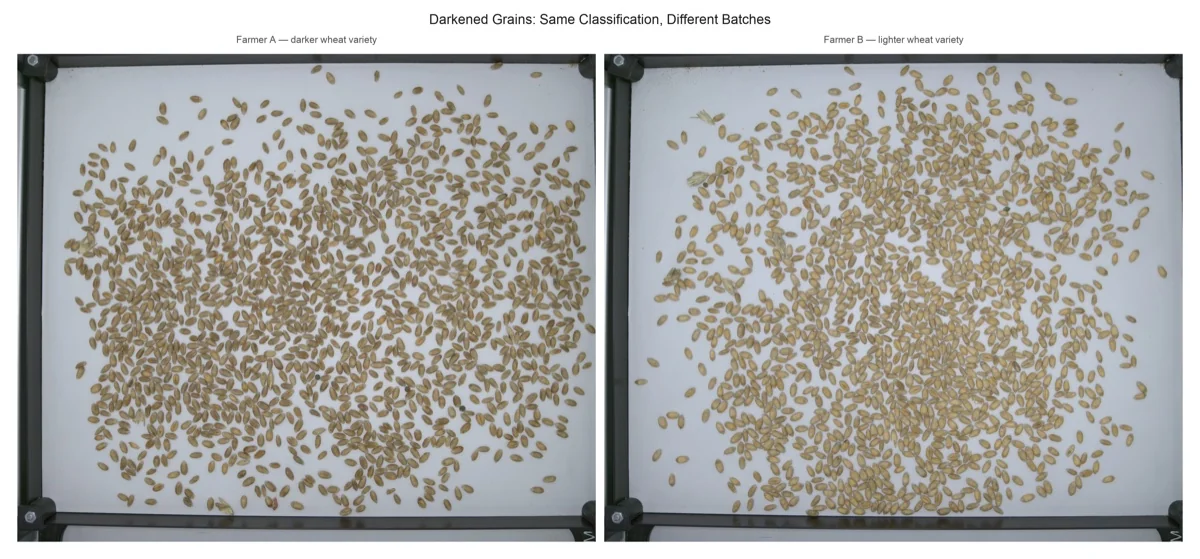
- Darkened grains hit a maximum discrepancy of 21.43% in week 1. The root cause: lighting variation in image capture, combined with the inherent subjectivity of what counts as “darkened” - a judgment that even human technicians made differently depending on the specific wheat variety.
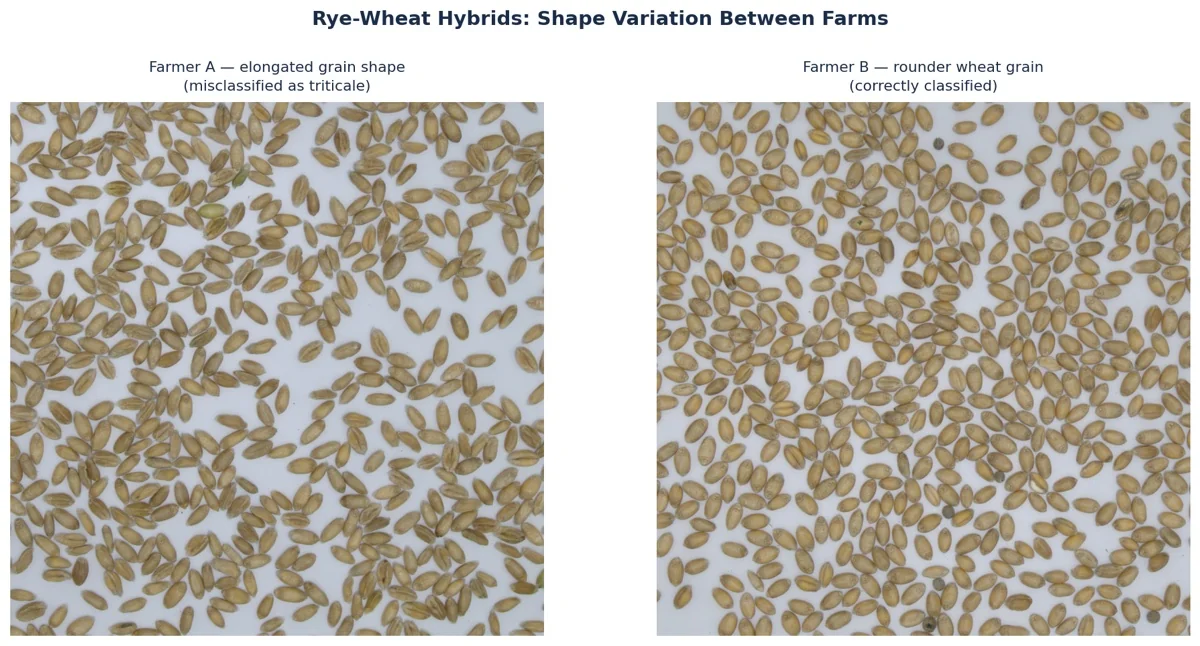
- Rye-wheat hybrids showed a maximum error of 13.89%. Triticale - a rye-wheat cross - shares enough morphological features with wheat that the model, without enough examples, struggled to distinguish them consistently.
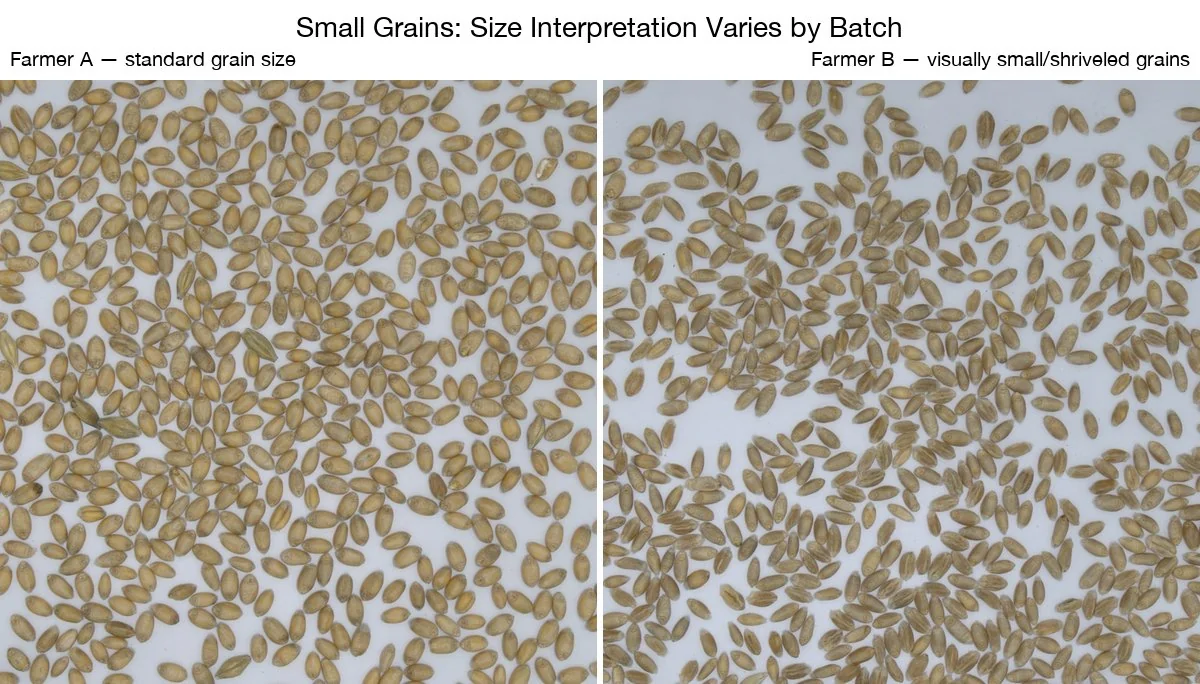
- Small / shriveled grains reached 9.37%. The issue was a mismatch between how the model defined “small” (visually) and how the lab defined it (by sieve size).
These were not random failures. Each had a clear, diagnosable cause, which meant each had a clear fix.
The feedback loop: from data to improvement
This is the part of AI development that is easy to underestimate. The model was not a fixed system that was installed and left to run. Every week’s results were analyzed, root causes were identified, and the training data was updated. More samples. Better labeling. Targeted rules for edge cases.
Model update milestones during the pilot:
| When | Update |
|---|---|
| First week | Removed minimally darkened grains from dataset; enhanced healthy wheat variety examples |
| Second week | Implemented confidence rule for rye detection - uncertain classifications rejected rather than forced |
| Fifth week | New model deployed: improved rye-wheat hybrid handling and lighter grain classification |
| Sixth week | Fusarium update: added pink and white fusarium examples; cleaned labeling for clear symptom cases |
| Seventh week | Small grains: excluded grains >2mm from the shriveled category to match sieve-based lab standard |
The pattern is deliberate: identify where the model diverges from expert judgment, understand why, add more data that covers that case, retrain, and measure again. This is how AI performance compounds over time.
During this same period, something else became visible in the weekly reviews. In several samples, GrainODM flagged impurities that the lab had scored as zero:
| Impurity type | GrainODM detection | Lab result |
|---|---|---|
| Sprouted grains | 1.05% | 0.00% |
| Sprouted grains | 0.95% | 0.00% |
| Damaged grains | 0.90% | 0.00% |
| Barley | 0.08% | 0.00% |
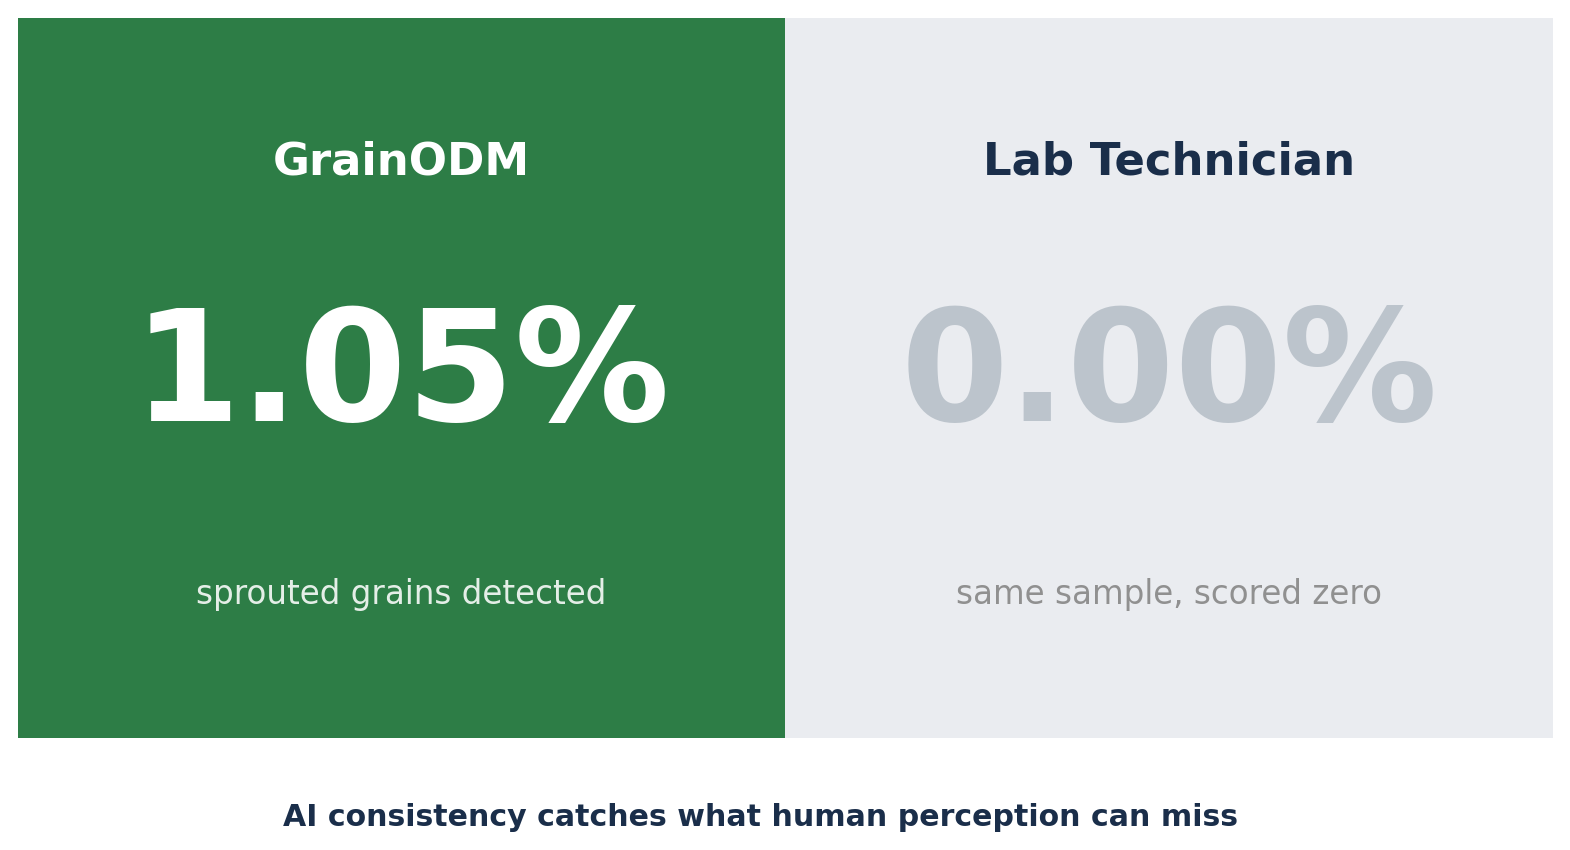
The AI was not wrong. It was detecting at the edge of human perception: individual grains that can be missed in a long shift, in a batch that looks otherwise clean. Consistency across every grain in every sample is something machines are simply better at than humans over time.
The results of the feedback loop
By late September, the improvement was measurable:
- Rye-wheat hybrids: from 13.89% max discrepancy down to 0.25% - a 98% reduction
- Small grains: from 9.37% down to 1.70% - an 82% reduction
- Darkened grains: from 21.43% down to 6.96% - a 68% reduction
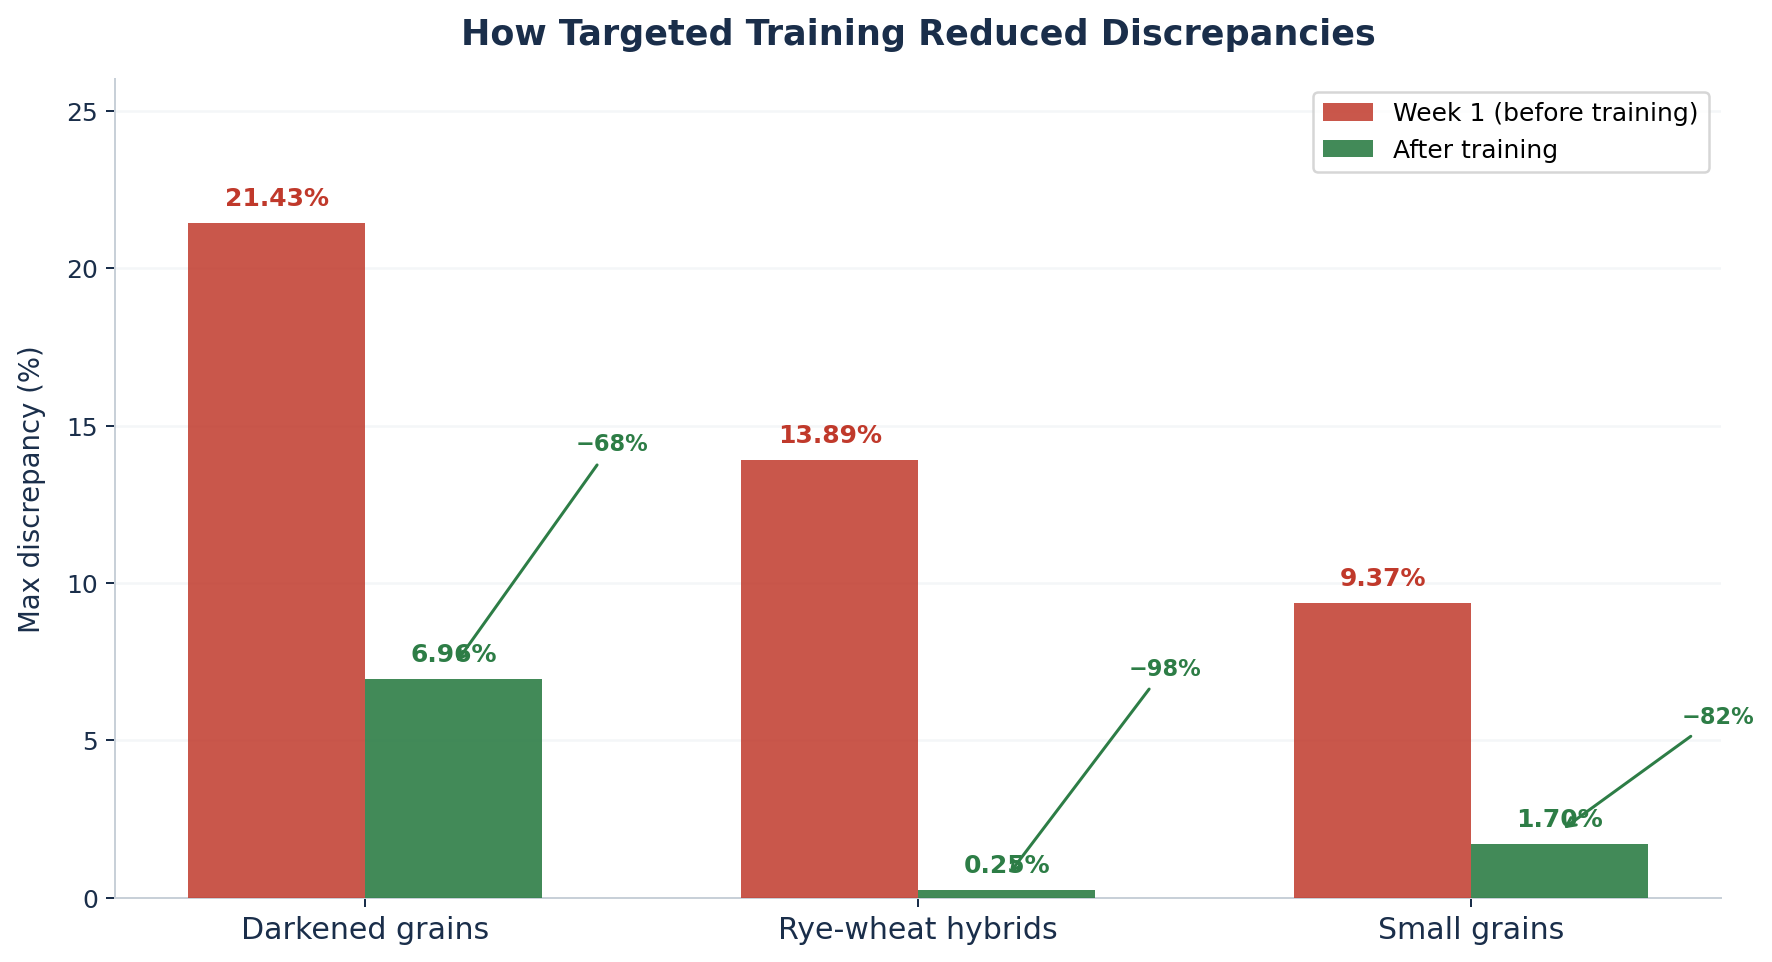
Each improvement came from the same mechanism: more targeted data, better labeling, and a clearer definition of the classification boundary. The model did not get smarter in a general sense; it got smarter about specific hard cases, because it was shown more examples of those cases.
This is what AI development looks like in practice.
Phase 2: The final test
In January 2026, after four months of parallel testing, we ran the formal validation session.
Five professional grain technicians independently analyzed 16 wheat samples. GrainODM analyzed the same samples. No one saw anyone else’s results until it was over. Every sample was graded across 18 impurity categories, with full quality classification.
This was the go/no-go moment. Pass the validation, and the system goes into production. Fall short, and we go back to the drawing board.
The results
| Metric | Result |
|---|---|
| AI matched at least 1 technician | 96.2% |
| AI matched 3 out of 5 technicians | 95% |
| AI average agreement with all technicians | 93.5% |
| AI matched all 5 technicians simultaneously | 85% |
Two impurity categories reached 100% agreement between the AI and all technicians (husks and sprouted grains), while others like foreign seeds and damaged grains still left room for improvement.
What the numbers actually mean
Here is the context that makes these results significant.
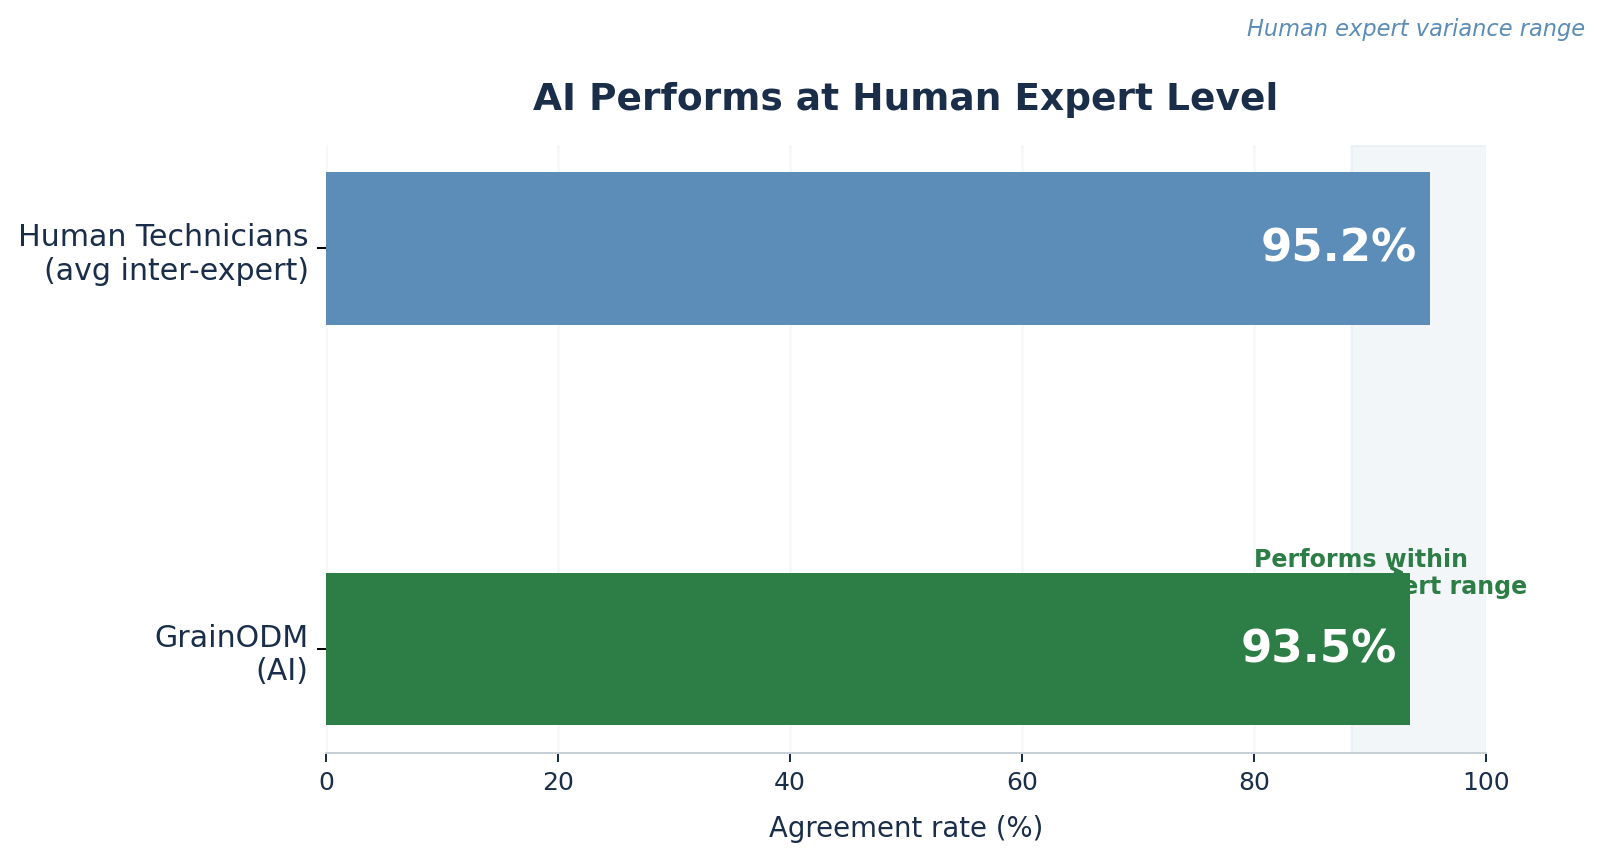
When the five technicians graded the same samples independently, their average agreement with each other was 95.2%. They are experts, but they are human; subjective judgment on subtle visual distinctions means they do not always land on exactly the same number.
GrainODM came in at 93.5%.
That figure sits within the natural variance of human expert disagreement. Not approaching it from below, but remaining inside it. The AI performs at the level of a trained technician. Adding GrainODM to an assessment process is statistically equivalent to adding a sixth expert to the team.
To put that in context: when five technicians graded the same 16 samples under identical conditions and the same classification rulebook, they did not unanimously agree on the final quality grade for 6 of 16 samples. On 2 of those, it was a genuine 3-vs-2 split — meaning the same batch, assessed by a different group of technicians on a different day, could have received a different grade.
Grain classification at the grade level is inherently a judgment call. Even for experts working from the same rules.
This is where consistency matters. GrainODM applies the same logic to every sample, every time — no variation between shifts, no accumulated fatigue, no subjective drift. Given identical inputs, it produces identical outputs. That is not something any human assessor can guarantee at scale.
The decision: approved for production
The pilot passed the validation gate. The validation results showed that the AI could work at expert level under real intake conditions.
Real grain batches. Real financial classifications. The system’s outputs feed directly into grain quality grade decisions, which determine pricing, storage, and downstream use. This is not a sandbox. These are real stakes.
What this means for grain quality control
Grain quality assessment has always required skilled people. That is not going away.
What changes is the workload distribution. A system that performs at human expert level - consistent across thousands of samples, never fatigued, detecting at the edge of human perception - changes what human experts spend their time on. Routine classification becomes automated. The edge cases, the ambiguous batches, the trend analysis across suppliers - those stay with the people trained to think about them.
The question was never whether AI could replace grain technicians. The question was: can AI perform reliably enough to work alongside them?
After 4 months, 600+ tests, and a formal validation against five independent experts, the answer is yes.
Frequently Asked Questions
Across 16 wheat samples and 18 impurity categories, the AI showed 93.5% average agreement with five independent lab technicians. Human technicians agreed with each other at 95.2%, so the AI performed within the natural range of expert disagreement.
All samples came from real incoming wheat loads at a commercial grain facility. The AI and the lab team evaluated the same batches in parallel over roughly four months, covering hundreds of routine intake tests rather than a hand-picked test set.
The most challenging categories were darkened grains, rye-wheat hybrids, and small or shrivelled kernels, plus fusarium. Targeted retraining reduced errors in the first three categories significantly; fusarium remains the main area where more labeled data is needed.
The validation described here is specific to wheat and this facility's grading practices. However, the process—run a parallel pilot on real samples, compare AI decisions to multiple experts, and iterate on the hardest cases—can be repeated for other crops, facilities, and standards.
The New Standard in Grain Purity Analysis
Data, not guesswork. Learn how GrainODM sets a new benchmark for digital grain inspection.